
The Financials YTD Averages report shows the average figures for the key financial performance indicators over a year.
- Open the library with reports.
- Select Financials YTD Averages.
- Define criteria for generating the report, as follows:
For the Month of Select the month as of which the report will be generated. The system will generate the report for the yearly period up to the selected month. View Select the view for report generation: Corporate – the report will be generated for all Franchise Offices within the selected Master Zone. Master – the report will be generated for all Franchise Offices within the selected Master Zone. Master Zone Select the Master Zone which the report will be generated. The system will sample data from Franchise Offices within the selected Master Zone. Select View Select the view for report generation: Summary View – the report will be generated for all Franchise Offices within the selected Master Zone. Selected Office – the report will be generated for the selected Franchise Office. If you select the Selected Office option, you will need to select the Franchise Office for report generation.
Include Closed Offices Check the box to include the closed Franchise Offices into the report. By default, all closed Offices are excluded.
When complete, click Apply. The report is generated, as follows:
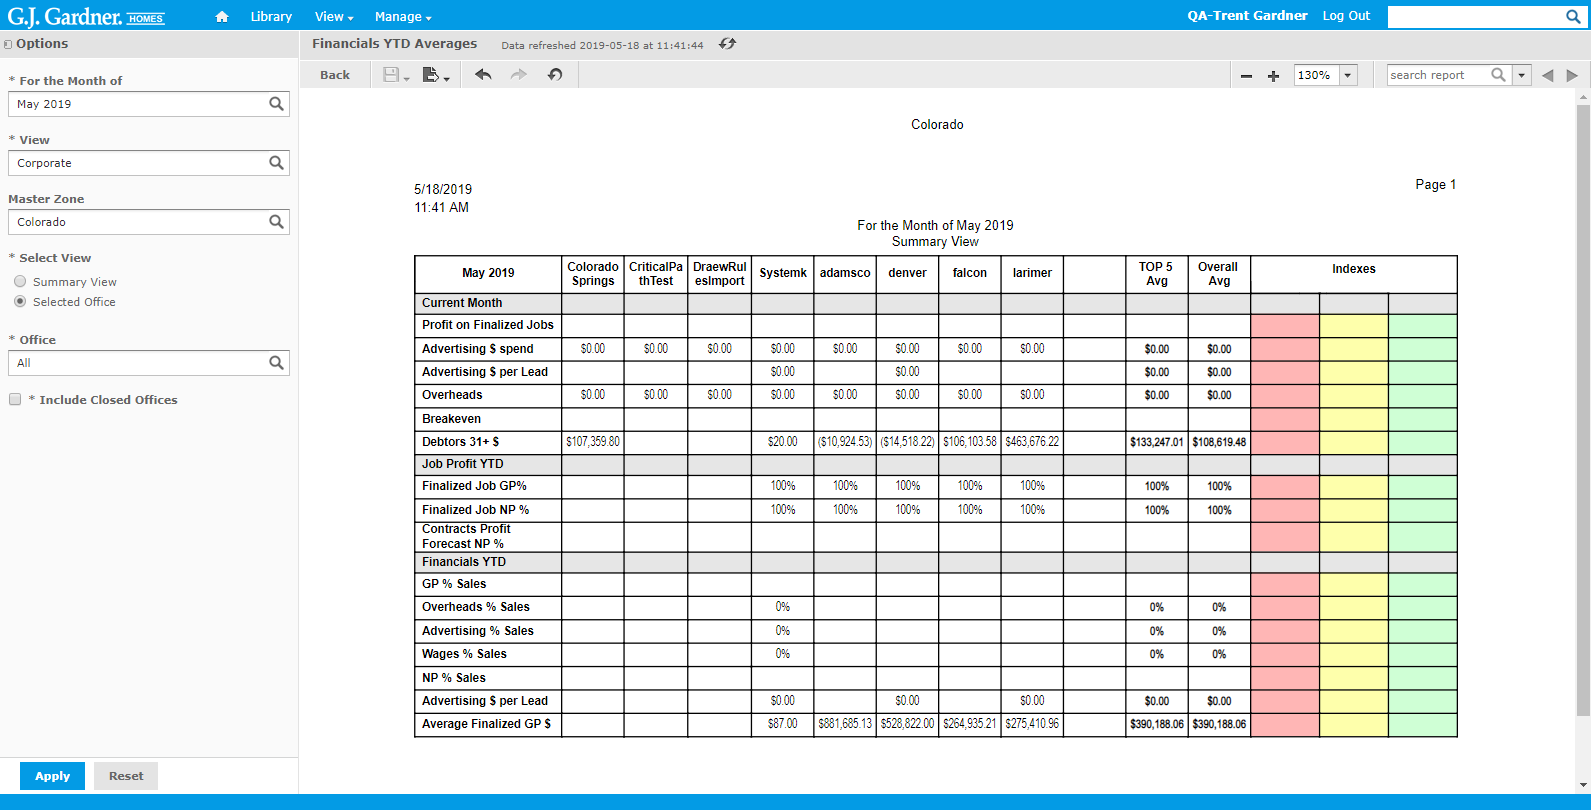
The summary report shows the following information:
The system calculates the average value for each key performance indicator (KPI) over the yearly reporting period ending at the selected month. The average value is calculated for the following KPI’s:
| CURRENT MONTH | |
| Profit on Finalized Jobs | Average profit ratio for finalized Jobs which finalized date falls within the reporting period. The system calculates the average value based as a ratio of contact prices with approved change orders to actual Job costs. |
| Advertising $ Spend | Subtraction of the sum of accounting balances (as of the the 1st day of the selected month) from the sum of accounting balances (from the latest month within the reporting period). |
| Advertising $ Per Lead | Advertising $ Spend amount divided by the number of Leads over the reporting period. Leads are selected based on the meeting date. |
| Overheads | Subtraction of the sum of account balances (as of the 1st day of the selected month) from the sum of account balances (from the latest month within the reporting period). |
| Breakeven | Ratio of the Overheads to the Average Finalized Gross Profit amount.
The Average Finalized Gross Profit is calculated as sum of contract amounts of Finalized Jobs including approved Change Orders which is divided by the number of Finalized Jobs in the Office. Finalized Jobs are selected when the finalized date falls within the reporting period. |
| Debtors 31+ | Sum of authorized and paid invoices which due date is 31-days or greater than the last day of the selected month. |
| JOB PROFIT | |
| Finalized Job GP% | Sum of contract prices including the approved Change Orders with the subtracted Job Actual Costs that is further divided by Contract prices including the approved Change Orders.
The system includes only finalized Jobs which finalized date falls within the period starting from the first day of the financial year and ending on the last day of the month selected in the filter. |
| Finalized Job NP% | Sum of contract prices including the approved Change Orders with the subtracted Job Actual Costs and Overheads that is further divided by Contract prices including the approved Change Orders.
The system includes only finalized Jobs which finalized date falls within the period starting from the first day of the financial year and ending on the last day of the month selected in the filter. Overheads are calculated as the accounting journal balance as of the latest day in the financial year with the subtracted accounting journal balance as of the first day of the financial year. |
| Contracts Profit Forecast NP% | Contract prices with approved Change Orders that are multiplied by the Finalized Job GP% and the Overheads that are subtracted from this figure. The resulting value is further divided by the contract prices with the approved Change Orders.
Overheads are calculated as the accounting journal balance as of the latest day in the financial year with the subtracted accounting journal balance as of the first day of the financial year. |
| FINANCIALS YTD | |
| GP % Sales | Percentage ratio of gross profit to the sales amount.
The sales amount is calculated as the sum of invoice amounts (including only authorized or paid invoices). Only invoices which accounting date falls within the monthly period selected in the For Month filter. GP amount is calculated as subtraction of Job accounting expense balance from the Sales amount. Only Jobs which Finalized Date falls within the monthly period selected in the For Month filter. |
| Overheads % Sales | Percentage ratio of total overhead expenses to the sales amount.
The sales amount is calculated as the sum of invoice amounts (including only authorized or paid Invoices). Only invoices which accounting date falls within the monthly period selected in the For Month filter. Total overhead expenses are calculated as sum of accounting journal balances as of the end of the selected month with the subtracted sum of accounting journal balances as of the start of the selected month. |
| Advertising % Sales | Percentage ratio of advertising amount to the sales amount.
The sales amount is calculated as the sum of invoice amounts (including only authorized or paid Invoices). Only invoices which accounting date falls within the monthly period selected in the For Month filter. The advertising amount is calculated as subtraction of sum of accounting journal balances (as of the 1st day of the month selected in the filter) from the sum of accounting journal balances (as of the last day of the month selected in the filter). |
| Wages % Sales | Percentage ratio of wages amount to sales amount.
The sales amount is calculated as the sum of invoice amounts (including only authorized or paid Invoices). Only invoices which accounting date falls within the monthly period selected in the For Month filter. The wages amount is calculated as subtraction of the sum of accounting journal balances (as of the 1st day of the month selected in the filter) from the sum of accounting journal balances (as of the latest day in the month selected in the filter). |
| NP % Sales | Percentage ratio of NP amount to the Sales amount.
The sales amount is calculated as the sum of invoice amounts (including only authorized or paid Invoices). Only invoices which accounting date falls within the monthly period selected in the For Month filter. The NP amount is calculated as subtraction of Job Actual Costs and Overheads from the sales amount. |
| Advertising $ per Lead | Percentage ratio of the total of advertising spend YTD amount to the number of Leads YTD.
The total of Advertising spend YTD amount is calculated as subtraction of the sum of accounting journal balances (as of the first date of the financial year) from the sum of accounting journal balances (as of the latest date of the financial year). The number of Leads is determined by the number of meetings in the Sales Folders which the 1st communication date falls within the financial year period. |
| Average Finalized GP % | Percentage ratio of the subtracted Job Actual Costs from the sum of contract prices with approved Change Orders to the number of Finalized Jobs. |
When the report is generated for the specific Office, it will look as follows:
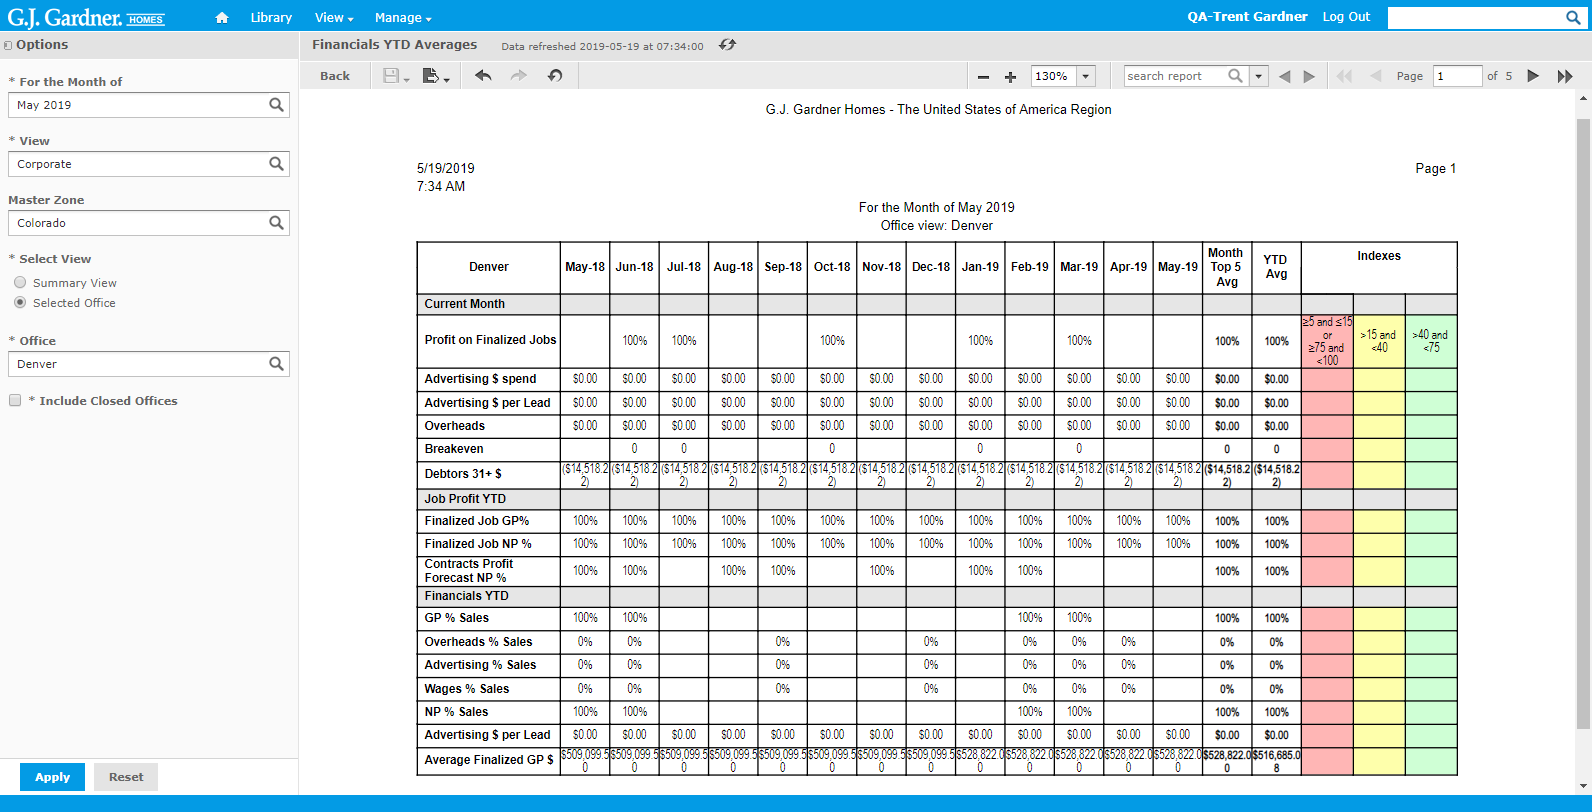
Unlike the summary report, this report shows figures for each month within the yearly period as of the selected month.
The Month Top 5 Avg column shows the average value for each KPI aggregated over the five months with the greatest values.