The Salesperson Budgets report shows the list of Leads or Sales for a specific Salesperson. Additionally, you can show graphs with the cumulative planned and actual Salesperson budgets broken down by Leads or Sales.
Running the Report
- Open the library with reports.
- Select Salesperson Budgets.
- Define criteria for generating the report, as follows:
Salesperson Select the Salesperson who the report you want to generate the report for. Period From … To … Select the time period for report generation. Budget Type Select the budget type which the report will be generated for, as follows: Leads – the report is generated for Leads. Sales – the report is generated for Sales. Show Graphs Only Check the box to shown only graphs in the report. 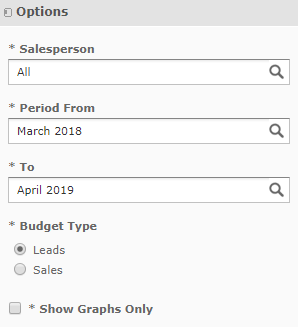
3. When complete, click Apply.
Leads by Salesperson
The report on Leads looks as follows:
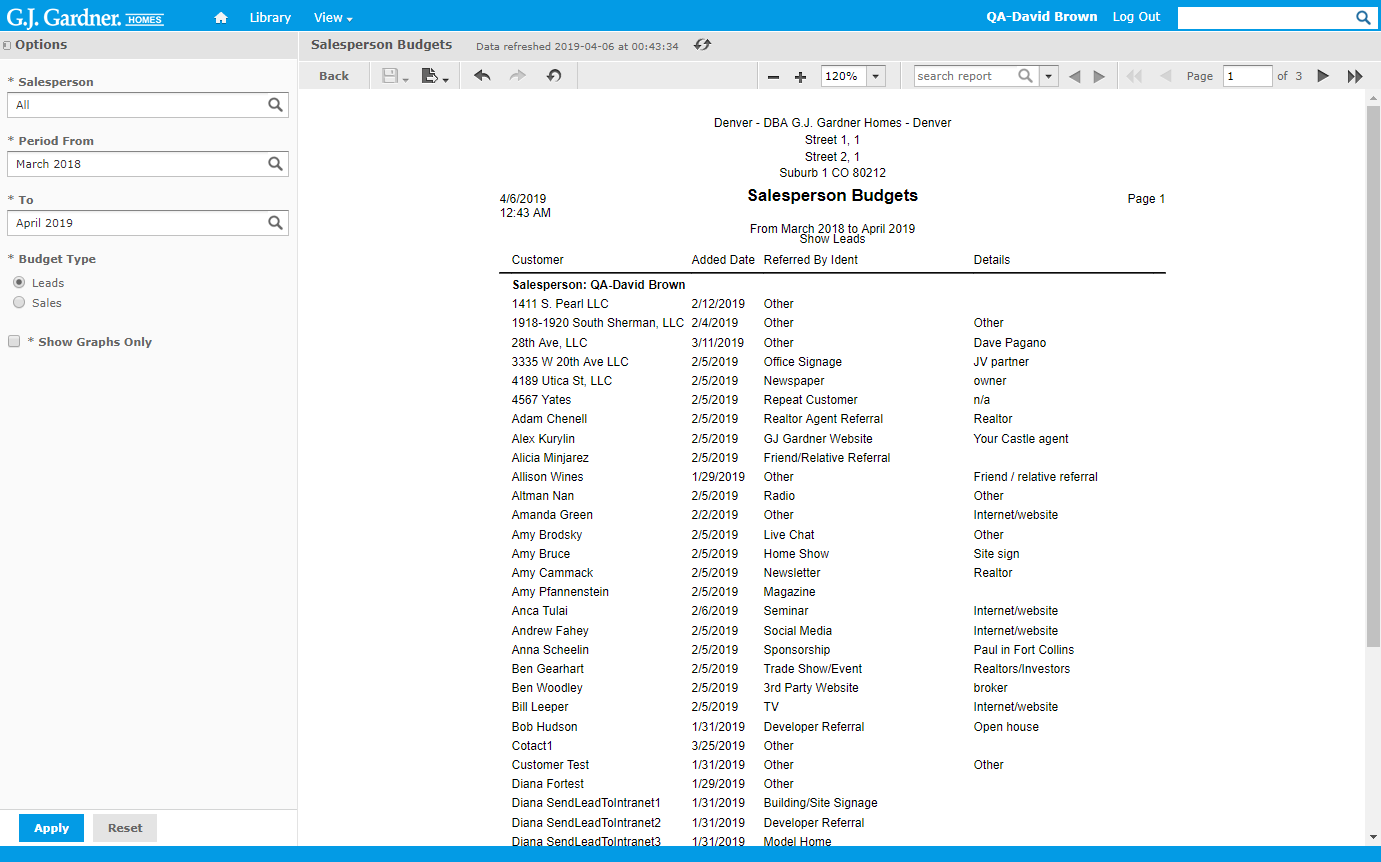
The report shows Leads grouped by a Salesperson. The following information is showed in the report:
| Customer | Name of the Customer that was added by the Salesperson. |
| Added Date | Date when the Customer was added by the Salesperson. |
| Referred by Ident | Referral type for the Customer. |
| Details | Description of the Referral. |
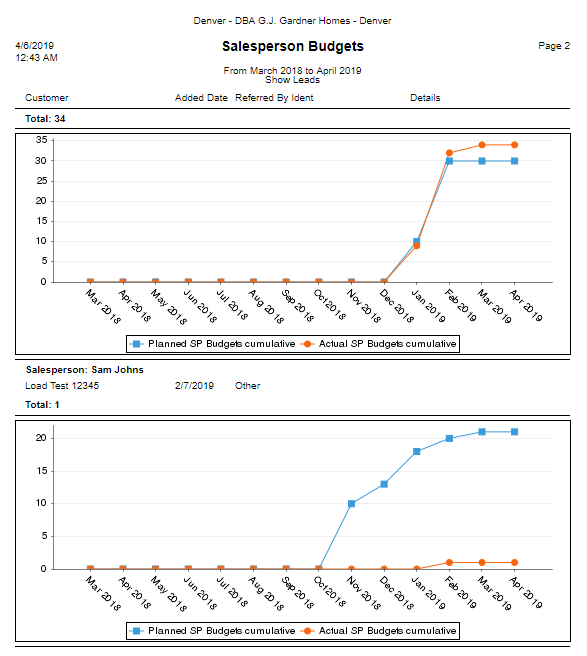
Additionally, the line charts are generated that show the actual cumulative number of Leads added by the Salesperson over the selected time period compared against the planned values.
The graphs are generated for all Salespersons and for each Salesperson in particular, as follows:
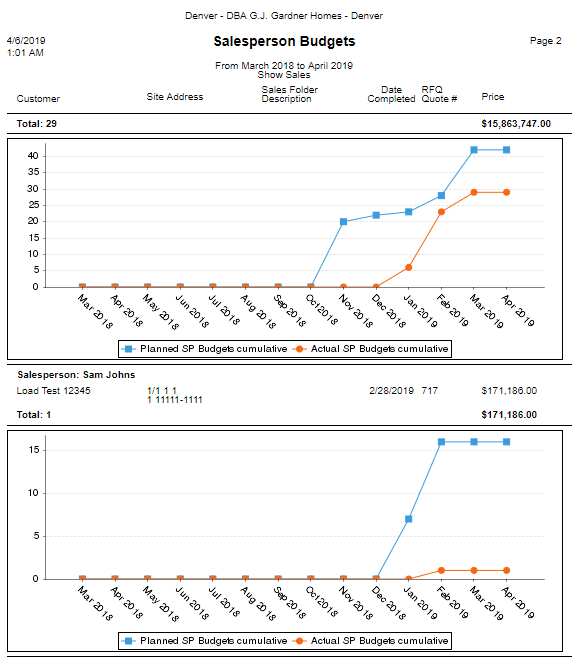
Sales by Salesperson
The report on Sales looks as follows:
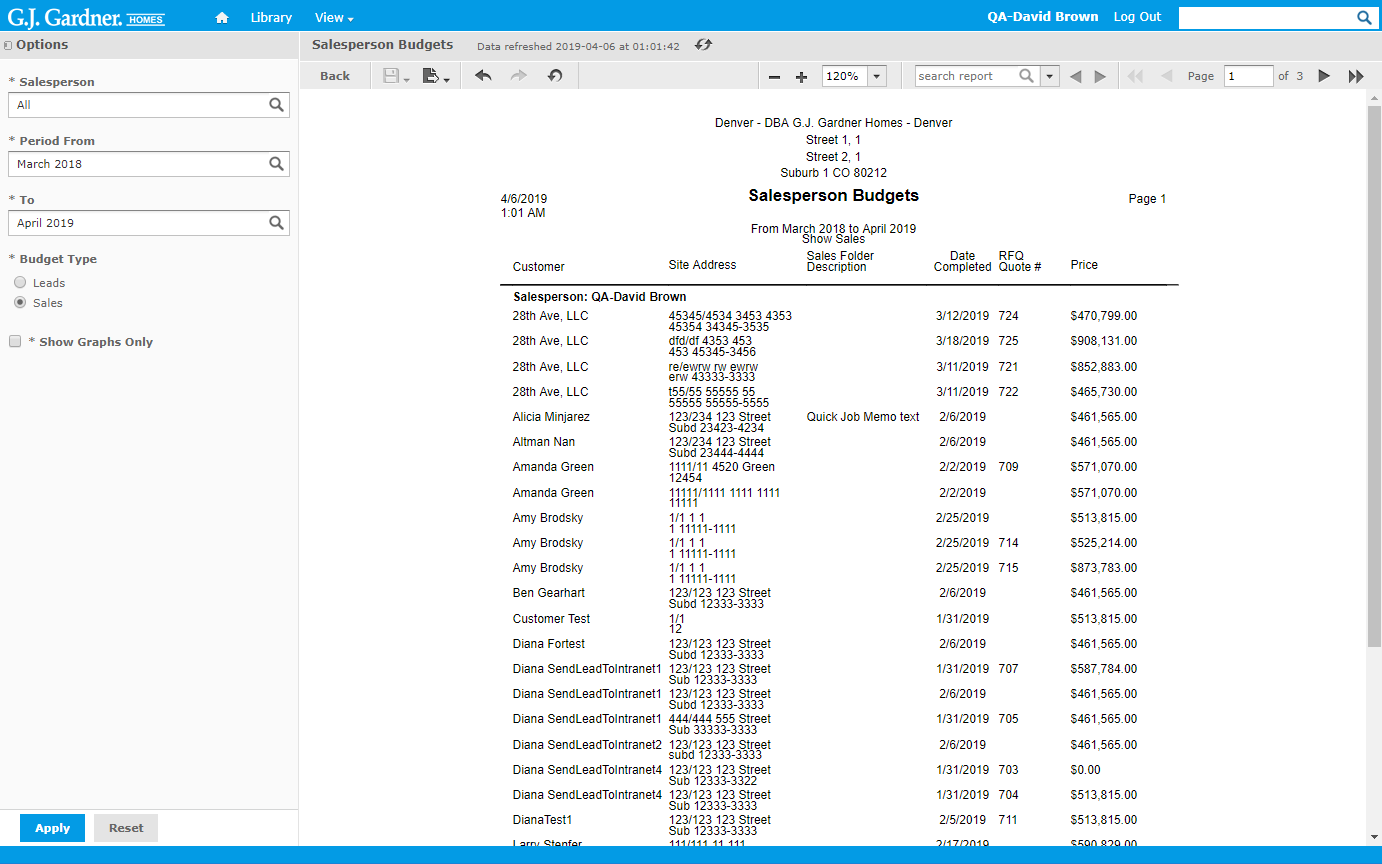
The report shows Sales grouped by a Salesperson. The following information is showed in the report:
| Customer | Name of the Customer who the Sale was completed for. |
| Site Address | Address of the Site which the Sale was completed for. |
| Sales Folder Description | Description of the Sales Folder. |
| Date Completed | Date when the Sale was completed. |
| RFQ Quote # | Number of the RFQ Quote. |
| Price | Sale price. |
Additionally, the line charts are generated that shows the actual cumulative number of Sales completed by the Salesperson over the selected time period compared against the planned values.
The graphs are generated for all Salespersons and for each Salesperson in particular, as follows: