
The Sales Dashboard is a set of charts and graphs that show the aggregated view of sales information for the current Office.
To open the Dashboard, on the navigational sidebar, select Dashboard. The Dashboard page opens, as follows:
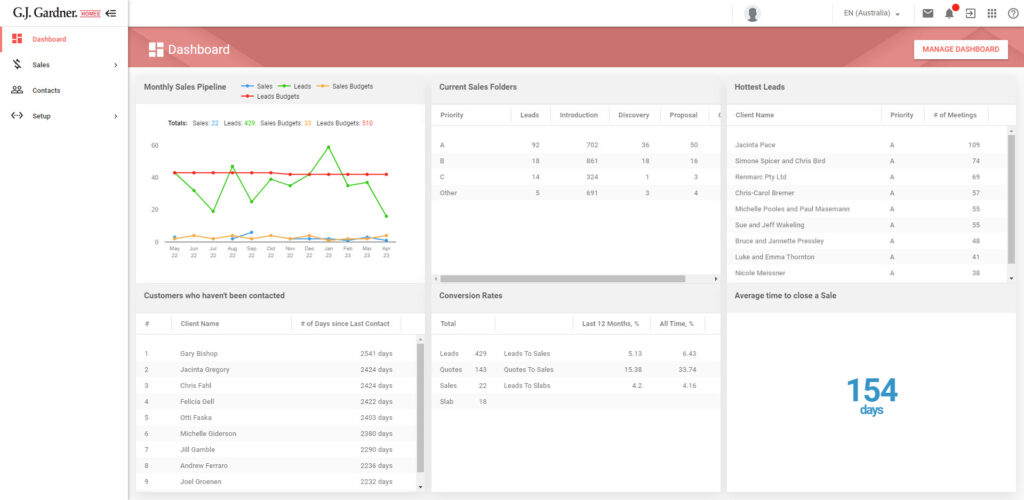
The Dashboard page accommodates the following widgets:
- Monthly Sales Pipeline
- Current Sales Folders
- Average Time from Sales Folder Created to Deposit
- Hottest Lead
- Customers Who haven’t been Contacted
- Conversion Rates
Monthly Sales Pipeline
You can use the Monthly Sales Pipeline widget to find out the following:
- correlation of actual Sales against the Budget Sales
- correlation of actual Leads against the Budget Leads
Using this widget you can estimate the performance of your Salespersons and see how efficient their achievements are against the planned objectives.
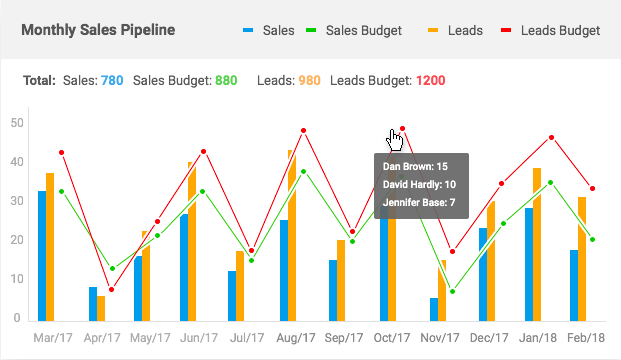
The widget shows information for the last 12 months as of the current month. It shows the line chart showing the following:
- distribution of Sales and Sales Budgets per month
- distribution of Leads and Leads Budgets per month
You can hover over the points on the line charts to see values broken down by Salespersons for each performance indicator.
Data is shown for the current Office only.
Current Sales Folders
You can use the Current Sales Folders widget to find out the following:
- breakdown of Sales Folders by stage and priority
Using this widget you can see the number of Sales Folders for each stage. These Sales Folders are further broken down by priority.
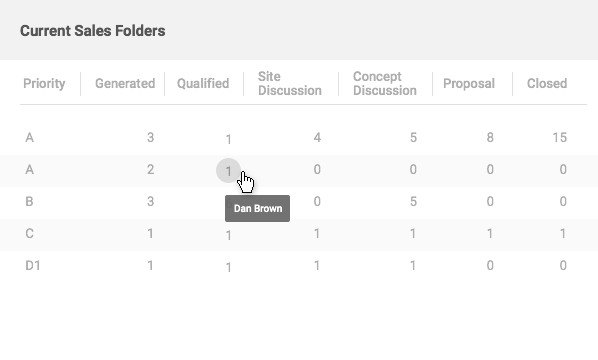
The widget shows information about Leads in accordance with the permissions the user has, as follows:
- View all Leads – the table shows Sales Folders for all Leads registered in the Office.
- View Salesperson’s Leads – the table shows Sales Folders of the current user and Leds of Salespersons’ who shared with this user.
- View own Leads – the table shows Sales Folders of Leads of the current user only.
You can hover over the values in the table to see the contacts (Leads’ names).
Data is shown for the current Office only.
Average time from Sales Folder Created to Deposit
This widget shows the average time from the creation of the Sales Folder to its conversion into Deposit.
The widget calculates the Average Time for Sales Folders of Leads which the current user has access to. The widget considers the user’s permissions and samples Sales Folders for reporting accordingly, as follows:
- View all Leads
- View Salesperson’s Leads
- View own Leads
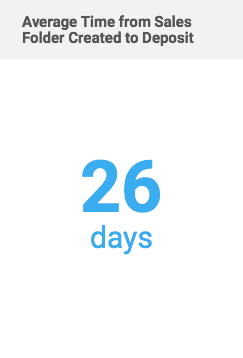 Data is shown for the current Office only.
Hottest Lead
This widget shows the hottest Leads sorted by priority of the Sales Folder and the number of meetings that were held with the Lead. The widget shows up to 10 Leads.
The widget considers the user’s permissions and samples Leads for reporting accordingly, as follows:
- View all Leads
- View Salesperson’s Leads
- View own Leads
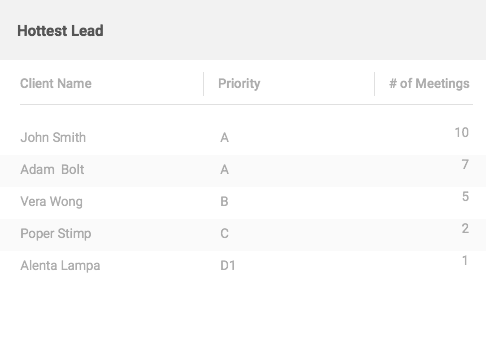
Data is shown for the current Office only.
Customers Who haven’t been Contacted
This widget shows the list of Leads with the longest time since the last contact with them. The widget shows up to 10 Leads. For each Lead in the widget, the following information is displayed:
- Client Name
- Number of Days Since Last Contact
The widget considers the user’s permissions and samples Leads for reporting accordingly, as follows:
- View all Leads
- View Salesperson’s Leads
- View own Leads
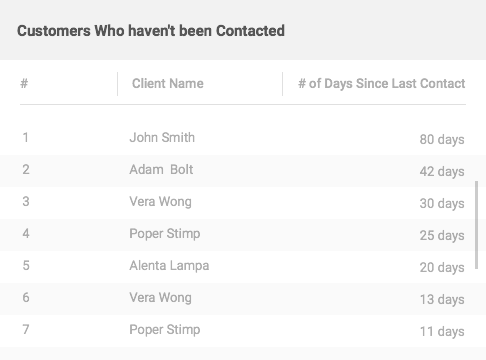
Data is shown for the current Office only.
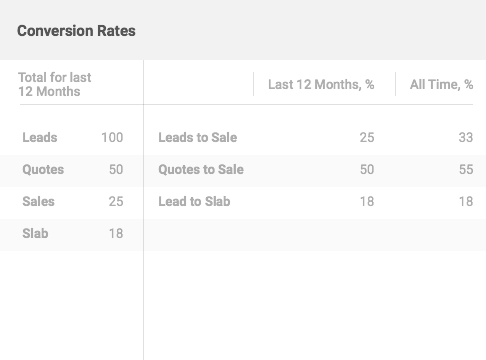
Conversion Rates
This widget shows the total number of Leads, Quotes, Sales, and Slabs for the last 12 months for the current Office.
Additionally, this widget shows the conversion rates (percentage) for the last 12 months and for all time, as follows:
- Leads to Sales (number of Leads divided by the number of Sales)
- Quotes to Sales (number of produces Quotes divided by the number of Sales)
- Leads to Slabs (number of Leads divided by the number of Slabs)
The widget considers the user’s permissions and samples Leads for reporting accordingly, as follows:
- View all Leads
- View Salesperson’s Leads
- View own Leads