The Simplified Chart for Multiple Jobs report shows the Jobs that are supervised by a specific Salesperson. The report visualizes the current status of each Job depending on the schedule type used.
Running the Report
- Open the library with reports.
- Select Simplified Chart for Multiple Jobs.
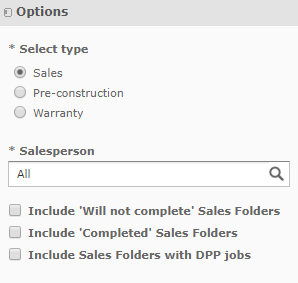
- Define criteria for generating the report, as follows:

Select type Select the schedule type which the report will be generated for: Sales – shows the Sales Folder status. Pre-Construction – shows the status of Pre-construction Schedule. Warranty – shows the status of Warranty Schedule. The further options will depend on the selected option value.
SALES Salesperson Select the Salesperson whose Sales Folders should be used for report generation. Include ‘Will not complete’ Sales Folders Check the box to include the Sales Folders being in the Will not complete state. Include ‘Completed’ Sales Folders Check the box to include the Sales Folders being in the Completed state. Include Sales Folders with DPP Jobs Check the box to include the Sales Folder with DPP Jobs. PRE-CONSTRUCTION Job Admin Select the Job Administrator whose Jobs should be used for report generation. Available when the Pre-Construction option is selected.
Include Jobs with Authority to Commence date Check the box to include Jobs with the Authority to commence date. WARRANTY Supervisor Select the Job Administrator whose Jobs should be used for report generation. Available when the Warranty option is selected.
Select Jobs Select the Jobs you want to include into the report. To select all Jobs, click Select All.
To clear selection, click Deselect All.
To invert the selection of Jobs, click Invert.
4. When complete, click Apply.
The look of the generated report will differ depending on the selected type.
Sales Schedules
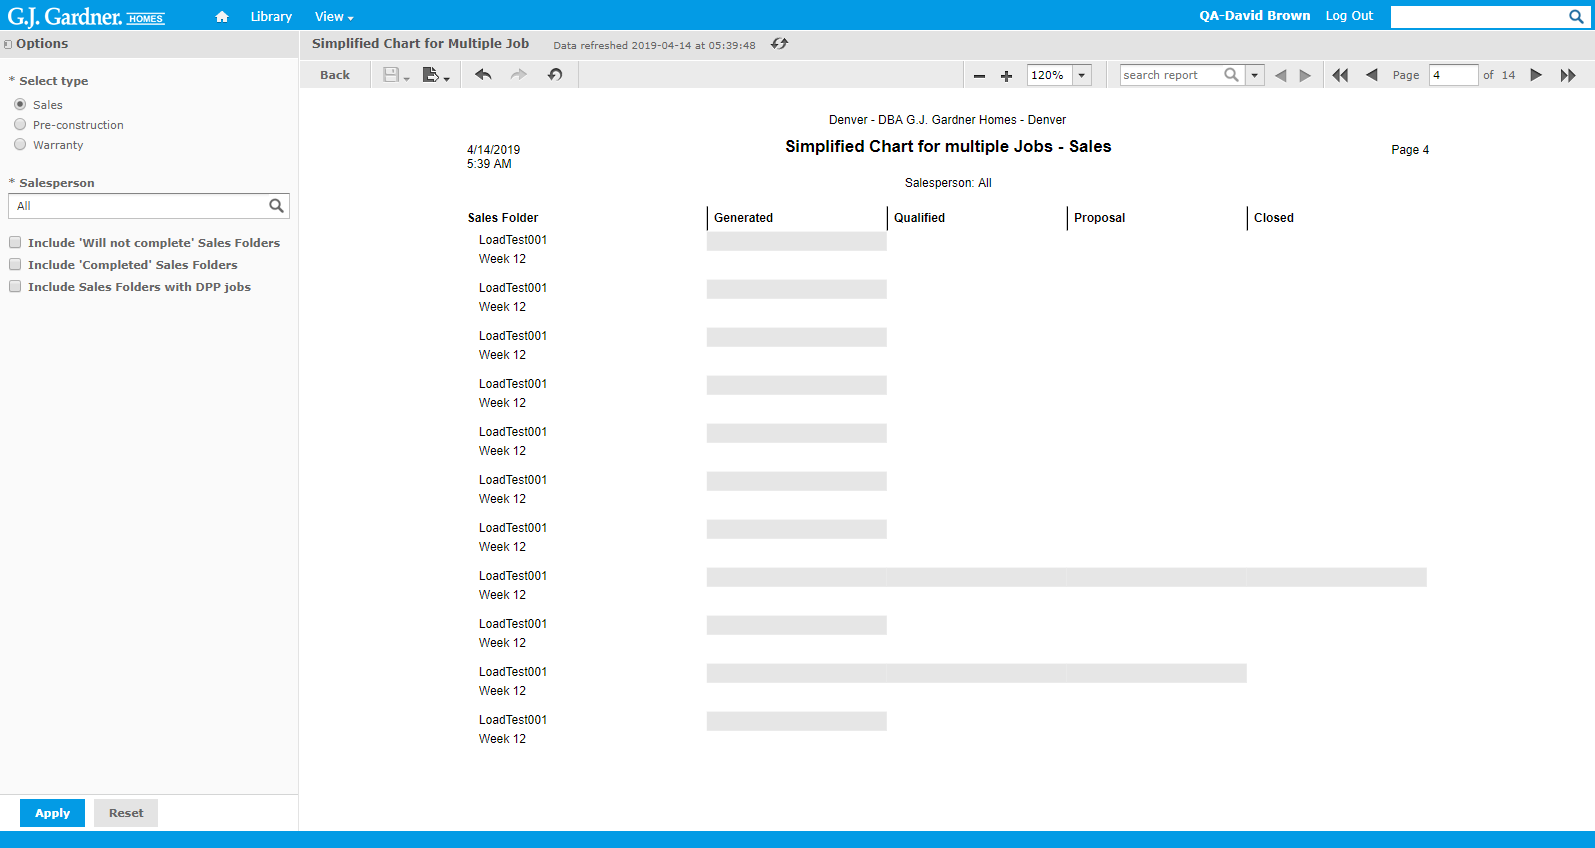
The report on Sales schedules will look, as follows:

The report shows the following information:
| Sales Folder | Name of the Sales Folder. |
| Columns with states | Four columns with states which the Sales Folder has passed. The current status of the Sales Folder is shown with bars being in the specific column.
States are the following:
|
Pre-Construction / Warranty Schedules
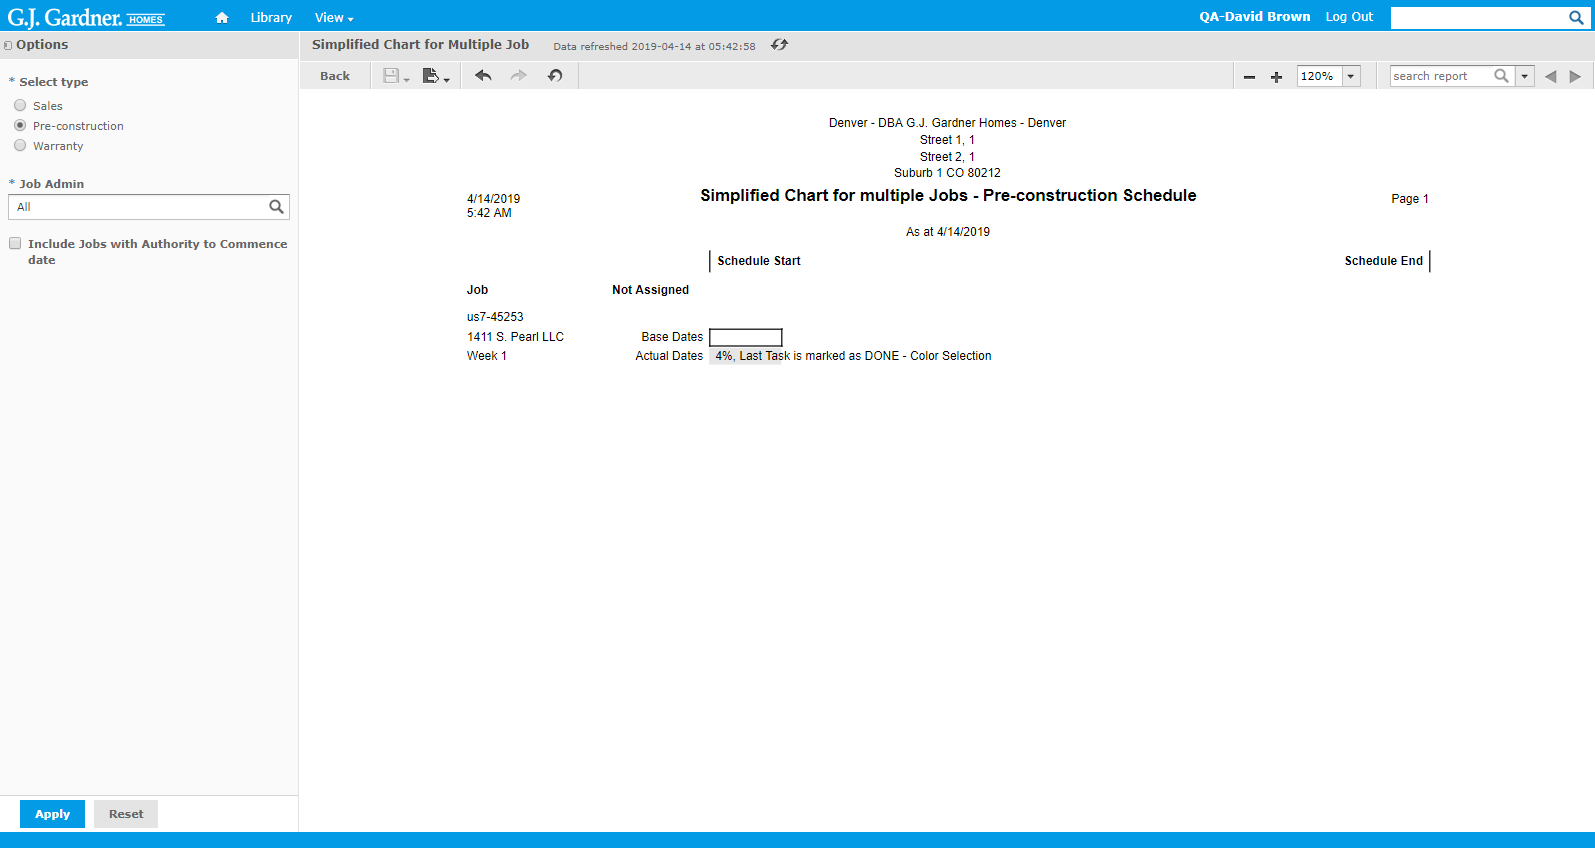
The report on Pre-Construction / Warranty schedules will look, as follows:

The report shows the following information:
| Job | Job number including the Office number as prefix, and the name of the Customer. |
| Job Supervisor | Name of the Job Supervisor who tracks completion of the Job. |
| Schedule Progress | The progress on the Pre-Construction / Warranty Schedule is indicated with the progress bars for Base Dates and Actual Dates. These progress bars come from the Schedule Start and ends at Schedule End. The current completion percentage is shown in the progress bars. You can compare the progress on tasks from the Pre-Construction / Warranty Schedule against base and actual dates. |

