Franchisee dashboard is a set of charts and data tables that allow you to get a quick insight into the key performance indicators and see construction issues at once.
To open the Dashboard, on the navigational sidebar, select Dashboard. The Dashboard page opens, as follows:
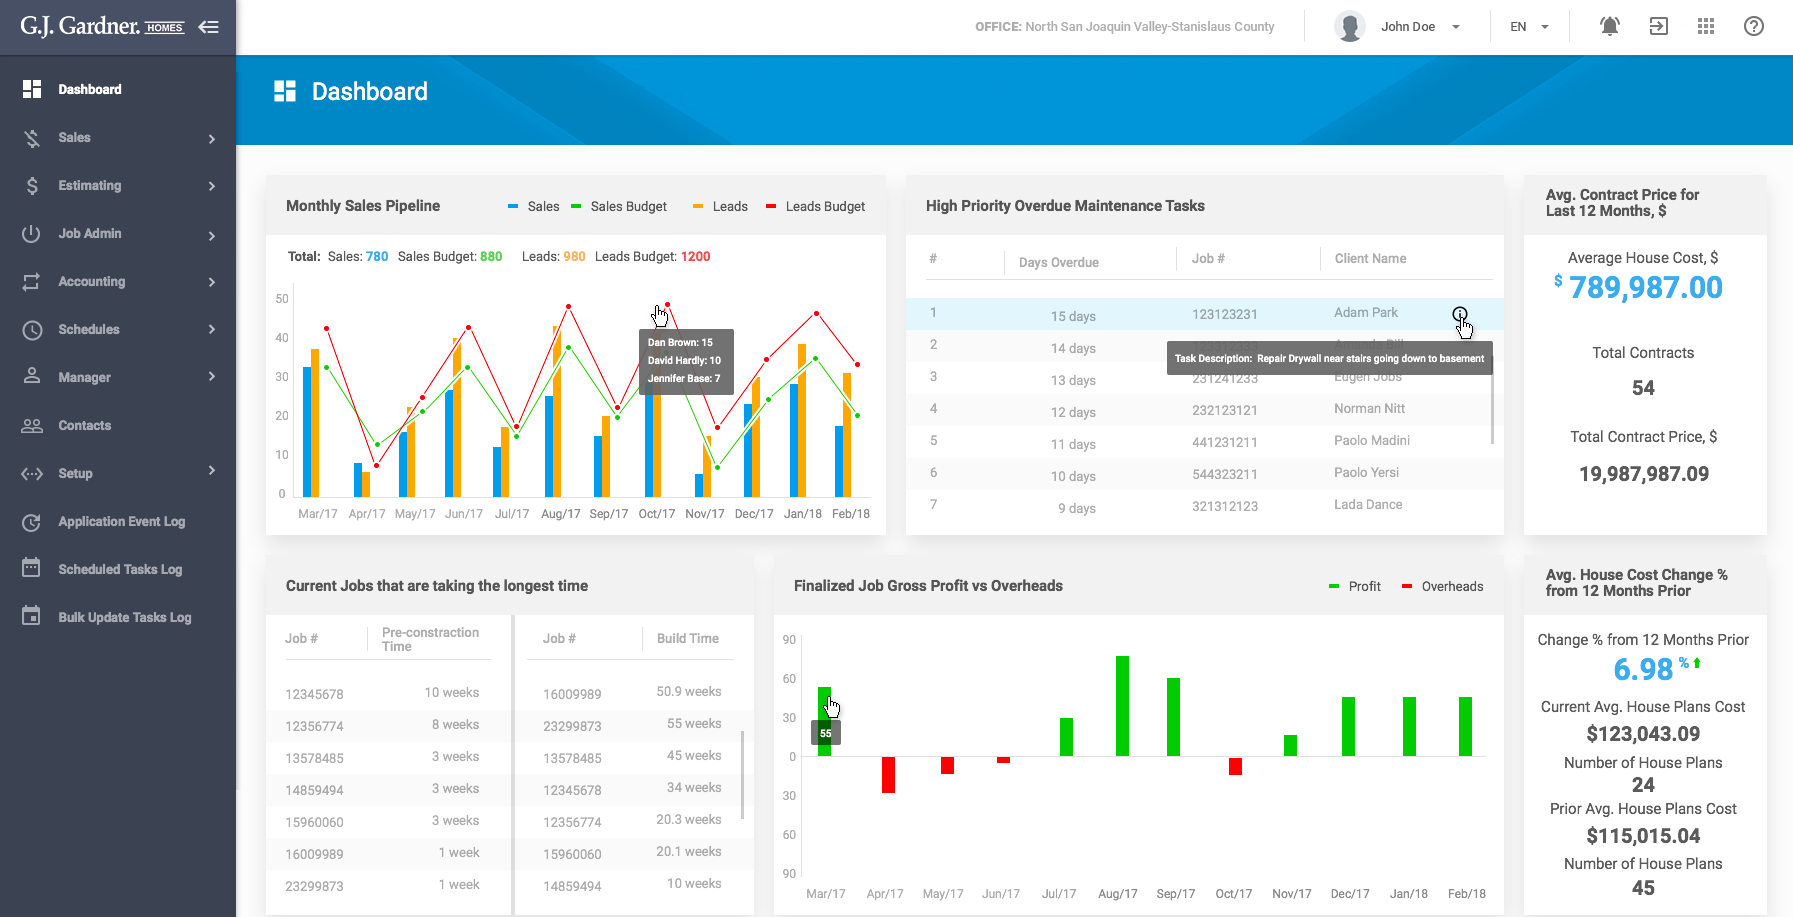
The Dashboard page accommodates the following widgets:
- Sales vs Leads vs Budgets
- Warranty tasks 21+ days overdue
- Pre-construction & Build Times per Job
- Finalized Job Gross Profit vs Overheads
- Average Contract Price for Last 12 months
- Average House Cost Change % from 12 months prior
Monthly Sales Pipeline
You can use the Monthly Sales Pipeline widget to find out the following:
- correlation of actual Sales against the Budget Sales
- correlation of actual Leads against the Budget Leads
Using this widget you can estimate the performance of your Salespersons and see how efficient their achievements are against the planned objectives.
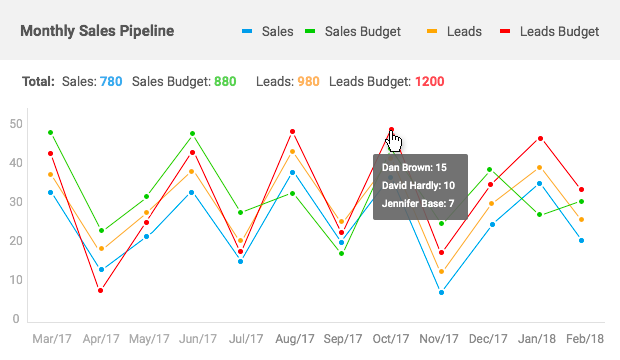
The widget shows information for the last 12 months as of the current month.
You can hover over the points on the line charts to see the distribution of Sales Budget and Leads Budget by Salespersons.
The column chart shows the correlation of actual Sales against the number of Leads. The system samples all Leads which Salespersons have meetings with.
The Total block shows the sum of all Sales, Sales Budgets, Leads, and Leads Budgets over the last 12 months as of the current month.
High Priority Overdue Warranty Tasks
You can use the High Priority Overdue Warranty Tasks gadget to find out the list of ten warranty tasks that are more than 21 days overdue. The gadget displays tasks in the descending order starting from the ones with the greatest number of days being overdue.
Using this gadget you can see the warranty tasks that should be addressed as soon as possible.
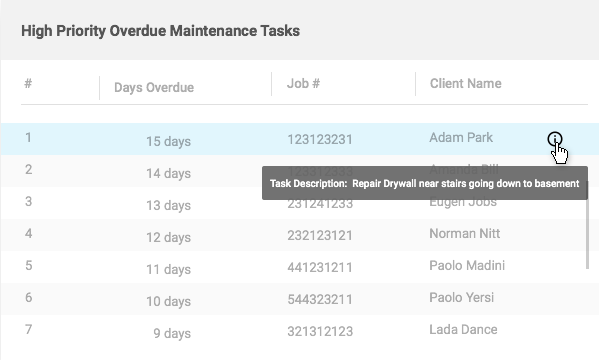
For each warranty task, the following information is displayed:
| # | Ordinal number of the task on the list. |
| Days Overdue | Number of days the tasks is being overdue. |
| Job # | Number of the Job which the Task attributes to. |
| Client Name | Name of the client which the Task relates to. |
To view task description, hover over the task and click the icon. In the displayed tooltip you can view the task description.
Current jobs that are taking the longest time
You can use the Current jobs that are taking the longest time widget to find out the list of Jobs with the longest pre-construction and build time. The widget samples Jobs with the longest duration from the sales date or from the commence date.
The widget displays two lists of Jobs: one with the longest pre-construction time, and the other with the longest build time. Each list can show up to ten Jobs in the descending order starting from the ones with the longest duration.
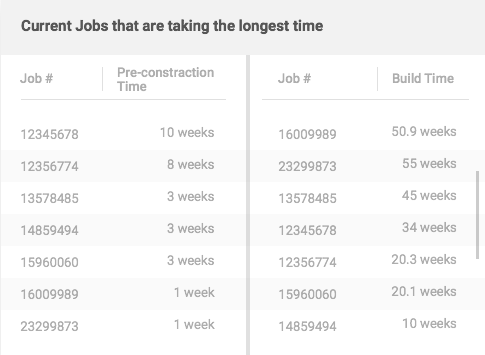
For each Job, the following information is displayed:
| Job # | Number of the Job with the longest pre-construction or build time. |
| Time | Either pre-construction or build time in weeks. |
Note
The pre-construction time is calculated on the basis of the Job’s Sales Date and Authority to Commence Dates. The time period between these two dates is considered as Pre-Construction Time. Ten Jobs with the longest Pre-Construction Time are shown in the widget.
Note
The build time is calculated for Jobs that are neither Finalized not Not Proceeding. Such Jobs should have a Construction Schedule with the Start Date. The build time is calculated as the period between the Schedule Start Date and the current system date. Jobs with the longest build time are shown in the widget.
Finalized Job Gross Profit vs Overheads
You can use the Finalized Job Gross Profit vs Overheads widget to compare between the Job Gross Profit against Overheads by month. The widget shows the last 12 months so you can see how profitable they were. You can further analyze the data and address any issues.
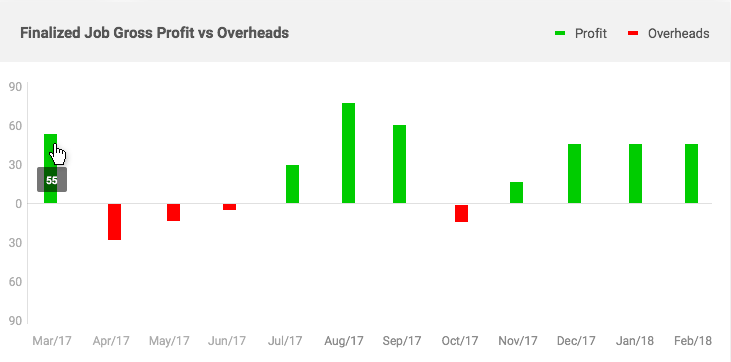
The widget shows the timeline with the green and red columns for the last 12 months. The green column stands for the Profit, and the red column for Loss. When you hover over a specific column you can see the amount of money you earned or took losses.
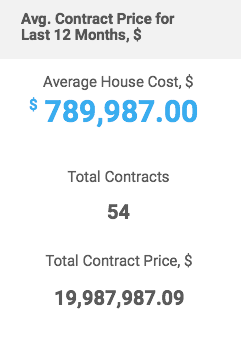
Average Contract Price for Last 12 months
You can use the Average Contract Price for Last 12 months widget to see the average contract price over the last 12 months. The widget calculates the average contact price on the basis of completed contracts over the last 12 months. Additionally, you can view the total number of completed contracts and see the total contract values over this time.
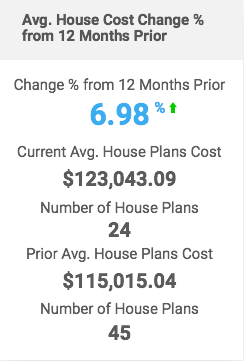
Average House Cost Change % from 12 months prior
You can use the Average House Cost Change % from 12 months prior widget to see the average change percentage in the House Costs over the last 12 months. The widget calculates the average percent which the original House Cost changes. The up or down arrow icon indicates whether there is an increase or decrease in the House Cost accordingly. Additionally, you can view the current average house plan cost and compare it against the prior average house plan cost.