
The Corporate dashboard is a set of charts and data tables that allow you to get a quick insight into the key performance indicators, sales activities, and see build issues at once.
Opening the Dashboard
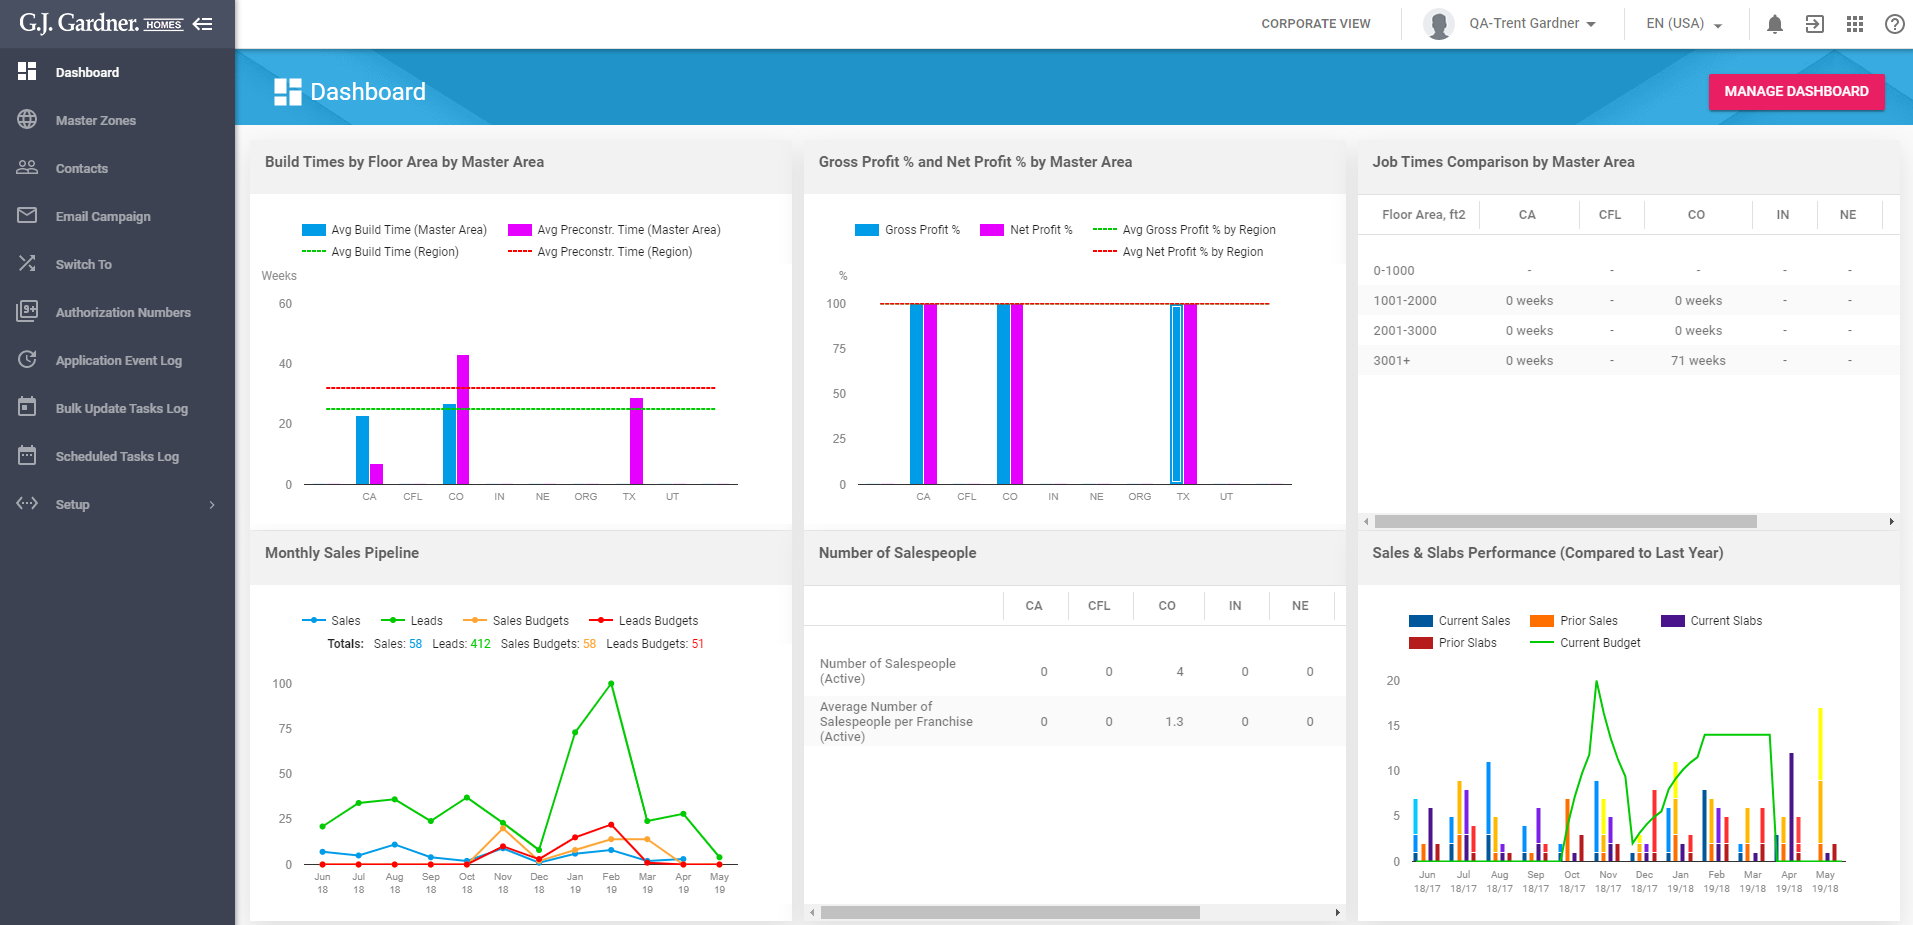
To open the Dashboard, on the navigational sidebar, select Dashboard. The Dashboard page opens, as follows:
The Dashboard page accommodates the following widgets:
- Build Times by Floor Area by Master Area
- Gross Profit % and Net Profit % by Master Area
- Job Times Comparison by Master Area
- Monthly Sales Pipeline
- Number of Salespeople
- Sales & Slabs Performance (Compared to Last Year)
Build Times by Floor Area by Master Area
You can use the Build Times by Floor Area by Master Area widget to compare the average construction time against the average pre-construction per each Master Area. Additionally, you can view the average values for the Corporate zone. The dashboard collects information across all Franchise Offices and aggregates them against Master Areas which they attribute to.
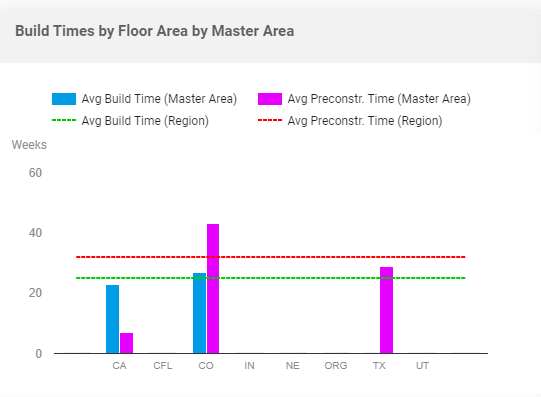
The column chart shows the average build time and pre-construction time in weeks. The dashed lines show the average build time and pre-construction time for the entire Corporate zone.
For calculation of the build time, the widget selects Jobs that meet the following criteria:
- Job has a Construction schedule.
- Construction schedule is not a virtual schedule.
- Handover date or Contractual date is specified.
- The Handover or Contractual date should fall within the 12-month period as of the current date.
The build time is calculated as a time period between the start date of the construction schedule and the Handover or Contractual date (the earliest date is chosen).
For calculation of the pre-construction time, the widget selects Jobs that meet the following criteria:
- Job has a Sale date and a Commence date.
- The Commence date falls within the 12-month period as of the current date.
The pre-construction time is calculated as a time period between the sale date and the commence date.
Monthly Sales Pipeline
You can use the Monthly Sales Pipeline widget to find out the following:
- correlation of actual Sales against the Budget Sales
- correlation of actual Leads against the Budget Leads
Using this widget you can estimate the performance of your Salespersons and see how efficient their achievements are against the planned objectives.
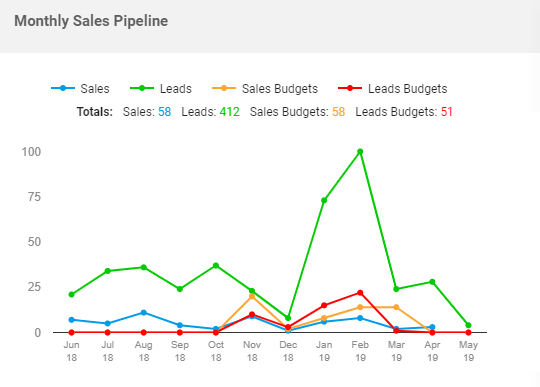
The widget shows information for the last 12 months as of the current month. The widget shows aggregated data from all Franchise Offices aggregated against Master Zones within the current Corporate Zone.
The widget displays the line chart with the following correlations:
- Sales against Sales Budgets
- Leads against Leads Budgets
The widget excludes all the Leads with empty Sales Folders.
You can hover over the points on the line charts to see the distribution of Sales, Leads, Sales Budgets, and Leads Budgets by Offices.
The Totals block shows the sum of the following values:
| Sales | Count of Job sales over the 12-month period as of the current date. All the empty Sales Folders are excluded during calculation. |
| Leads | Count of meetings over the 12-month period as of the current date. The meeting data should fall within this 12-month period. |
| Sales Budgets | Count of Sales Budgets figures from all Offices within the Corporate zone over the 12-month period as of the current date. |
| Leads Budgets | Count of Leads Budgets figures from all Offices within the Corporate zone over the 12-month period as of the current date. |
Sales & Slabs Performance (Compared to Last Year)
You can use the Sales & Slabs Performance (Compared to Last Year) widget to compare the monthly KPIs of Sales and Slabs figures in the current year against figures of the past year.
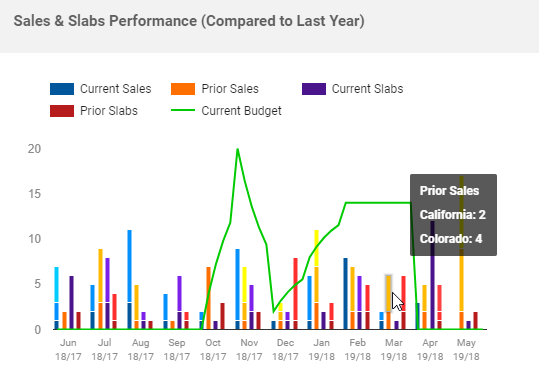
The column chart shows the following figures:
| Current Sales | Count of the Job Sales over the 12-month period as of the current date. The widget shows the stacked column aggregating values from multiple Master Zones within the Corporate Zone.
The widget includes only Jobs which Sale date falls within the reporting period. |
| Prior Sales | Count of the Job Sales over the past year for the same months as opposed to Current Sales figures. The widget shows the stacked column aggregating values from multiple Master Zones within the Corporate Zone.
The widget includes only Jobs which Sale date falls within the reporting period. |
| Current Slabs | Count of Slabs over the 12-month period as of the current date. The widget shows the stacked column aggregating values from multiple Master Zones within the Corporate Zone.
The widget includes only Jobs which Slab date falls within the reporting period. |
| Prior Slabs | Count of the Job Sales over the past year for the same months as opposed to Current Slabs figures. The widget shows the stacked column aggregating values from multiple Master Zones within the Corporate Zone.
The widget includes only Jobs which Slab date falls within the reporting period. |
The Sales Budgets line shows the Sales Budgets figures per each month within the 12-month period. The widget shows the count of Sales Budgets figures from all Master Zones within the Corporate Zone.
You can hover over a specific column to view figures per each Master Zone within the Corporate Zone.
Gross Profit % and Net Profit % by Master Area
You can use the Gross Profit % and Net Profit % by Master Area widget to find out the ratio of gross profit and net profit by each Master Zone within the Corporate Zone. Additionally, you can view the average figures for the entire Corporate Zone.
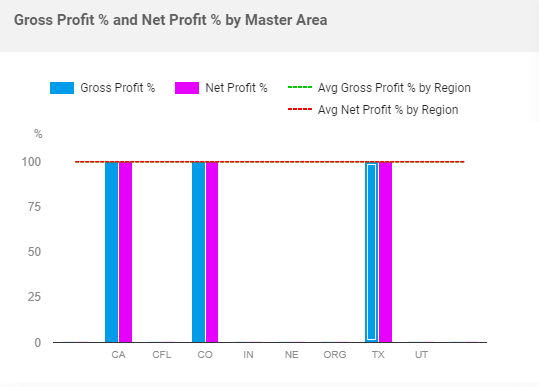
The column chart shows the gross profit and net profit percentages per each Master Zone. The dashed lines show the average gross profit and the average net profit percentages for the entire Corporate Zone.
The widget calculates the gross profit and net profit percentages over the 12-month period as of the current date on the basis of finalized Jobs only.
Job Times Comparison by Master Area
You can use the Job Times Comparison by Master Area widget to see the job time required to build houses within specific floor area ranges per each Master Area.
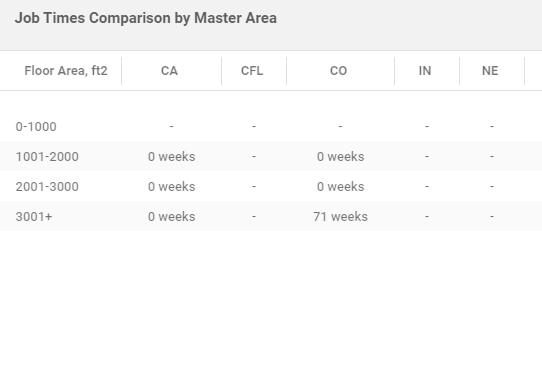
The widget shows the table with the following information:
| Floor Area, ft2 | Ranges of house floor areas. |
| Office (name) | Name of the Master Area which the Job time is calculated for. |
The Job time is calculated as average schedule duration for all Franchise Offices within a specific Master zone broken down by floor area ranges.
Number of Salespeople
You can use the Number of Salespeople widget to get insight into the number of Salespeople within each Master Area and see the average value per Franchise Office within the Master Area.
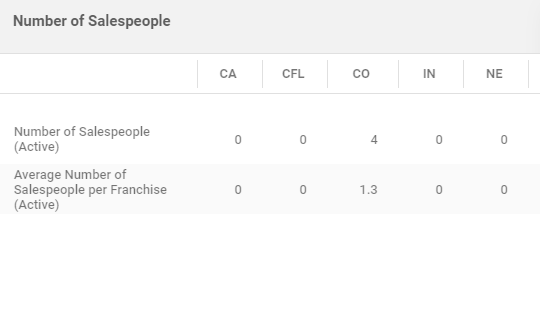
The widget shows the table with the following information:
| Number of Salespeople (Active) | Shows the total number of Salespeople from all Franchise Offices within the Master area. |
| Average Number of Salespeople per Franchise (Active) | Shows the average number of Salespeople per Franchise Offices within the Master area. |
Managing Widget Visibility
You can manage visibility of widgets on the dashboard.
To manage visibility of widgets, you need to have the Corporate system role.
- On the sidebar, select Dashboard.
- In the top right part of the screen, click Manage Dashboard.
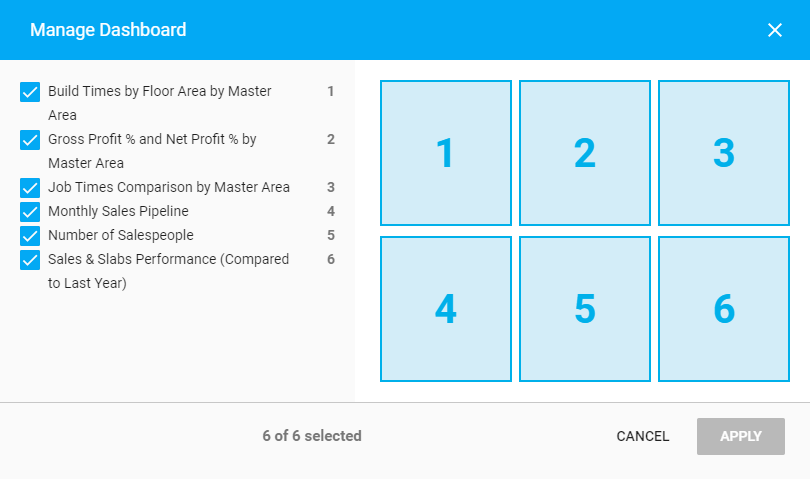
- In the Manage Dashboard – Widgets Visibility form, select the widgets you want to display on the dashboard. The system considers the order you select widgets and applies this order to displaying the widgets on the dashboard.
- Check or uncheck boxes for the widgets you want to show on the dashboard. The system will automatically fit the widgets depending on the number of widgets enabled for display.
- When complete, click Apply.