
The Supervisor’s Graphic Timeline report generates the timeline with tasks for Jobs for the upcoming period starting from the selected date. The report can be generated for all Supervisors or for a specific Supervisor.
- Open the library with reports.
- Select Supervisor’s Graphic Timeline.
- Define criteria for generating the report, as follows:
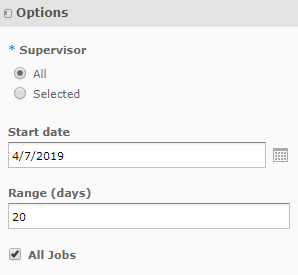
Criteria
| Supervisor | Select ‘All’ to generate the report for all Supervisor or ‘Selected’ to generate a report for a specific Supervisor. |
| Start date | Select the start date for sampling tasks for jobs being managed by Supervisors. |
| Range (days) | Specify the time range from the start date for including tasks into the generated report. You can set the range of days between 10 and 20. |
| All Jobs | Check the box to include all Jobs into the report. The system will include Jobs that do not have tasks within the reporting date range. |
4. When complete, click Apply.
The report in the basic format is generated, as follows:
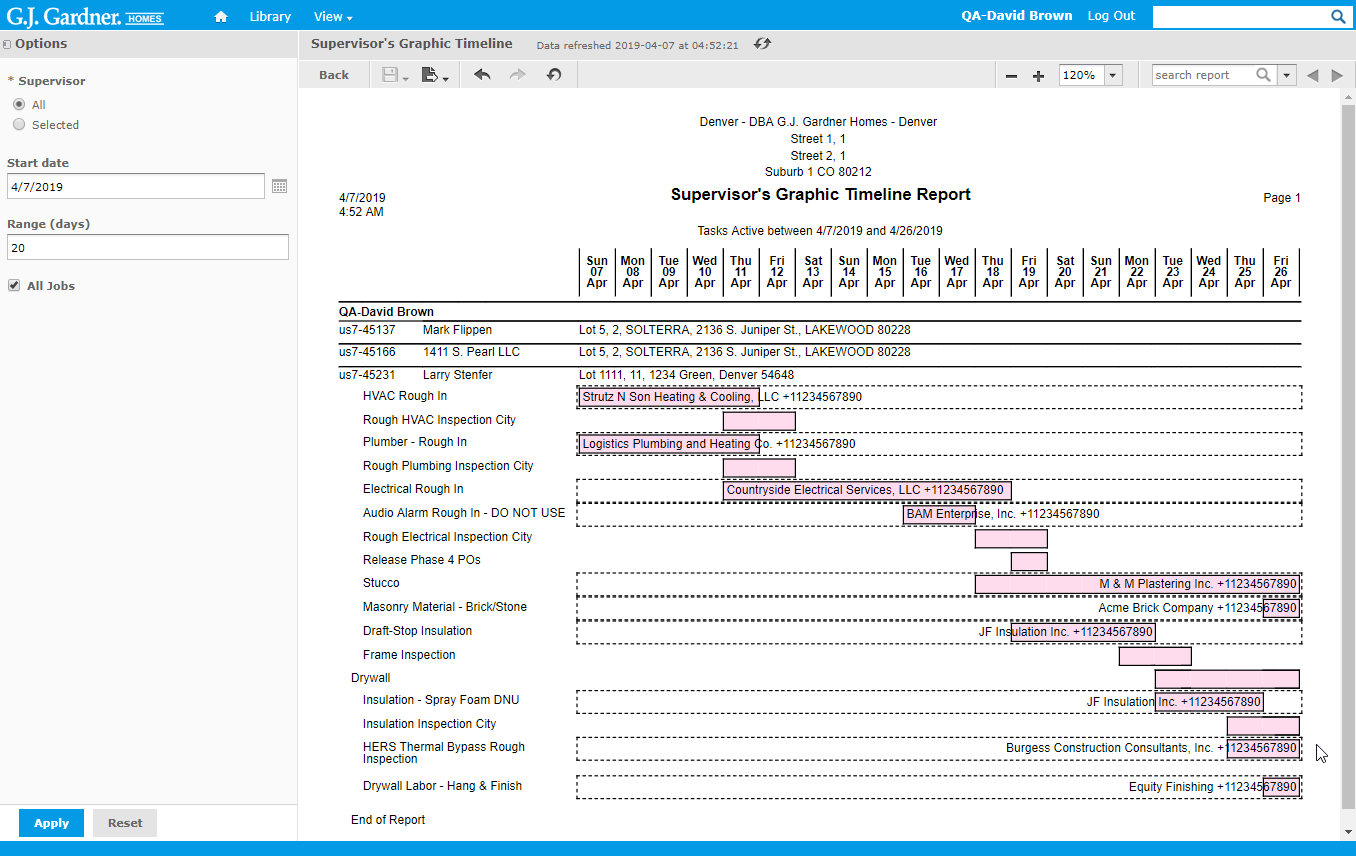
The report shows the following information:
Report Information
| Salesperson | Name of the Salesperson who the report is generated for. |
| Job | Job number including the Office’s number as prefix. |
| Client | Name of the Client who the Job attributes to. |
| Site | Site where the construction work is performed. |
| Task | Name of the task. |
All the tasks are displayed on the timeline as bars. The system distributes them on the timeline according to the start and end dates of tasks from the Construction Schedule.
On each task bar you can see the name of Contractor/Supplier and the contact phone number.